
Historical metrics
Applies to: BullMQ and pg-boss boards.
Worker Manager is a viewer, not a monitor, and its built-in throughput chart reflects that: it reads BullMQ's native queue.getMetrics(), a per-minute ring buffer capped at maxDataPoints, scoped to a single queue, and only as deep as that buffer's window. Restart the buffer's window, or just wait long enough, and the older points are gone. There's no long history and no cross-queue total, because BullMQ was never asked to keep one.
@worker-manager/metrics is an opt-in companion package that fills that gap. It doesn't replace the live chart, it adds a second, longer-retention path behind it: a recorder that snapshots the native metrics into Redis (or PostgreSQL) before they roll off, and a history provider you register with createWorkerManagerBoard that lets the UI read them back.
How it fits together
Two pieces, living in two different places.
MetricsRecorder runs in your own always-on process, typically wherever your workers already live. On an interval, it reads each queue's native completed/failed per-minute metrics and writes them into long-retention Redis buckets: a daily rollup per queue, plus a cross-queue global rollup. Writes are idempotent by minute, so it's safe to run the recorder in several processes, or restart it, without double-counting. There's no singleton to coordinate and no leader election.
RedisMetricsHistoryProvider runs wherever you build the board. You pass it to createWorkerManagerBoard({ options: { historyProvider } }). The core itself only defines the MetricsHistoryProvider interface and stays stateless: registering a provider just turns on one additional read endpoint that delegates to it. @worker-manager/metrics is the batteries-included implementation, with Redis and PostgreSQL storage, but if you already have a metrics store of your own, you can implement the interface directly instead of adopting this package. With no provider configured, nothing about the board changes.
Without an app: the CLI and the Docker image
If you aren't embedding Worker Manager in an app at all, the standalone CLI and the Docker image do both halves for you. @worker-manager/metrics ships as part of @worker-manager/cli, and --history registers the provider and starts a recorder in the same process:
On a PostgreSQL-only board (--postgres with no Redis) the history goes into PostgreSQL, in worker_manager_metrics_* tables in the BullMQ schema, created on start unless the board is --read-only.
The flag turns on showMetrics as well, so the range selector appears on queue pages and not only on the Metrics history page. --history-retention-days sets the window; per-tier retention, the snapshot interval and latency: false go in the CLI's config file under a history key. --read-only keeps the provider and drops the recorder, which is what you want when your workers already record and the CLI is only there to read.
Everything below still applies, from the precondition on your workers to the storage footprint and the Redis keys involved. The one difference is that the recorder follows the CLI's discovery instead of a fixed list, so a queue that shows up between rescans starts recording on the next tick.
Precondition: native metrics must be on
The recorder can only snapshot what BullMQ is already collecting, so your Workers need native metrics enabled with a window wide enough to survive any recorder downtime:
If metrics aren't enabled on the workers, queue.getMetrics() returns nothing, and the recorder has nothing to snapshot. Registering the historyProvider still turns the history UI on, but with no snapshots behind it the charts simply render empty, the same way the live metrics view does when metrics are off. A week-long window gives the recorder plenty of slack to catch up after a deploy or an outage before any minute falls out of the ring buffer unrecorded.
PostgreSQL-backed queues
BullMQ 6 can back a queue with PostgreSQL instead of Redis, and the recorder records those queues like any other. Counter metrics come from queue.getMetrics(), whose per-minute buffer the adapter dates from BullMQ's own metrics table, since BullMQ's PostgreSQL backend reports prevTS as 0. Latency and queue age are read from BullMQ's job table through the queue's own pool: finished jobs by finish time, which BullMQ indexes, and the oldest waiting job from a few probes on the ready index rather than a scan of the backlog. A paused or prioritized job is an ordinary waiting row there, so both count towards the queue age, as they do on Redis.
Where a queue lives and where its history is stored are independent. On a board that also has Redis, PostgreSQL queues record into Redis next to the Redis ones. On a board with no Redis at all, the history goes into PostgreSQL too.
PostgreSQL storage
For a deployment that runs BullMQ 6 entirely on PostgreSQL, PostgresMetricsStore keeps the history in the same database. It has the same tiers, retention, cross-queue rollup, latency histograms and queue-age gauge as Redis, behind the same provider contract, so the charts and the storage panel behave identically. pg is an optional peer dependency of the package; install it only for this.
connection takes what BullMQ's PostgreSQL backend takes, so the object you already give BullMQ can be reused, schema key included. The recorder and the provider never close a store they were handed; the provider can also be given { connection, schema, tablePrefix, migrate } directly, in which case it owns the store and await provider.disconnect() closes it. new MetricsHistoryAdmin({ store }) gives the same stats() and purge() as on Redis. Pass onSnapshotError to the recorder to hear about a tick that failed because the database was unreachable; the next tick simply retries.
Tables and migrations
Four tables in schema, each named with tablePrefix (default worker_manager_metrics_), which is also how two boards share one database:
The default was bull_board_metrics_ before v2.0, and the tables are not renamed for you. Pass tablePrefix: 'bull_board_metrics_' to keep the history a 1.x board recorded.
Rows are keyed by (queue, metric, tier, bucket), where bucket is a UTC minute, hour or day index and __global__ is the cross-queue rollup.
migrate: true creates whatever is missing on first use, in one transaction behind an advisory lock, so several processes starting together is fine. It creates the schema only if it does not exist, so an existing schema needs no database-level privilege. Without migrate, the first query checks the version and fails with instructions. Where the application role has no DDL rights, run the migration as a deploy step:
Same guarantees, in SQL
Every snapshot of a queue's metric is one transaction that diffs the incoming minutes against the stored minute rows and adds only the difference to the hour and day rows and to __global__, under an advisory lock on that queue and metric. Re-snapshotting after a restart, or from a second recorder, adds nothing, exactly as the Redis script does. The sampling lease is an upsert that only replaces an expired lease, on the database clock, so two recorders never sample the same queue on the same tick. Instead of TTLs, each writer deletes rows past each tier's window once a day. Autovacuum reclaims the space.
Sizing
A PostgreSQL row costs more than a Redis hash field: about 180 bytes per minute or hour counter and about 300 bytes per histogram row, indexes included. A queue busy every minute takes about 250 KB per metric per day of minute detail, or roughly 6.5 MB per busy queue at the default retention across counters, histograms and the gauge, plus the same once for the cross-queue rollup. That is several times the Redis figures in Storage footprint, and the minute window is still the one to tune.
In the storage panel, keys counts rows and bytes is the tables' actual on-disk size (pg_total_relation_size, indexes and TOAST included) split between queues and tiers in proportion to their rows' size, so the per-queue figures add up to what the tables occupy.
Job latency
Alongside the completed/failed counters, the recorder also tracks two histograms per queue: wait time and run time. Wait time is processedOn - timestamp, how long a job sat before a worker picked it up, and it's the signal that says you need more workers. Run time is finishedOn - processedOn, how long the handler itself took, and it's the signal that says the handler regressed. They're kept as two separate numbers rather than one combined figure because they point at different fixes: a wait spike means scale out, a run spike means look at the handler.
Collecting them needed no changes to your workers. BullMQ's moveToFinished does ZADD targetSet, timestamp, jobId when a job completes or fails, so the completed and failed sets are sorted sets scored by finish time. On the same tick that snapshots the counter metrics, the recorder scans each finished set past a watermark it keeps per queue, and that scan returns exactly the jobs that finished since the last tick, no more and no less, so there are no gaps and nothing is double-counted. Because it reads job hashes and sorted sets BullMQ already writes, latency sampling doesn't depend on queue.getMetrics() or the metrics worker option at all; the precondition above is only for the counter metrics.
The most important thing to understand about the wait histogram is what it can't see. It's built entirely from jobs that finished, so when a queue is genuinely backed up and jobs stop finishing, the histogram goes quiet exactly when the number matters most: a stalled queue looks identical to an idle one. That's why the recorder also records a queue-age gauge, the age of the oldest job still waiting, and the UI overlays it on the same axis as the wait chart. It keeps reporting when the histogram can't, because it doesn't depend on anything finishing. It's the same reason Sidekiq's Queue#latency measures how long the oldest job has been waiting rather than the latency of jobs it has already run.
Retries are excluded from the wait histogram, but not the run histogram. A job's timestamp field is set once, at creation, but processedOn is overwritten on every attempt, so a retried job's naive wait time would absorb every prior attempt and all the backoff between them. Run time has no such problem: every attempt gets its own sample, retried or not.
Percentiles read off these histograms are estimates, not exact values, bounded by the width of the bucket a sample landed in. The bucket layout is fixed and not something you can configure per queue, because two ranges holding different bucket layouts can't be merged into one percentile: a multi-day query has to combine buckets from different days, and that only works if every day used the same layout.
If a queue is configured with removeOnComplete: true, jobs are deleted the instant they finish, so there is nothing left in the completed set for the next tick to scan, and no latency data will ever appear for it. There's no error and no warning, just an empty chart. If latency data isn't showing up for a queue, this is the first thing to check. Removing jobs by hand does the same thing on a smaller scale: deleting a job, cleaning a finished set, or retrying a failed job takes it out of the set before the next tick reads it, so up to a tick's worth of samples can go missing. The counter charts are unaffected by any of that, because BullMQ counts a job as it finishes and never decrements when it is removed, which is why cleaning out old failures does not lower yesterday's failure line.
Latency shares the chart area with throughput behind a tab, on a queue's own page and on the Metrics history page alike, so you get one chart at a time rather than a stack of them. The totals above the chart follow the tab: completed and failed counts on Throughput, p95 run and p95 wait for the selected range on Latency. Wait time carries the queue-age gauge as a dashed line on the same axis, since both are durations:
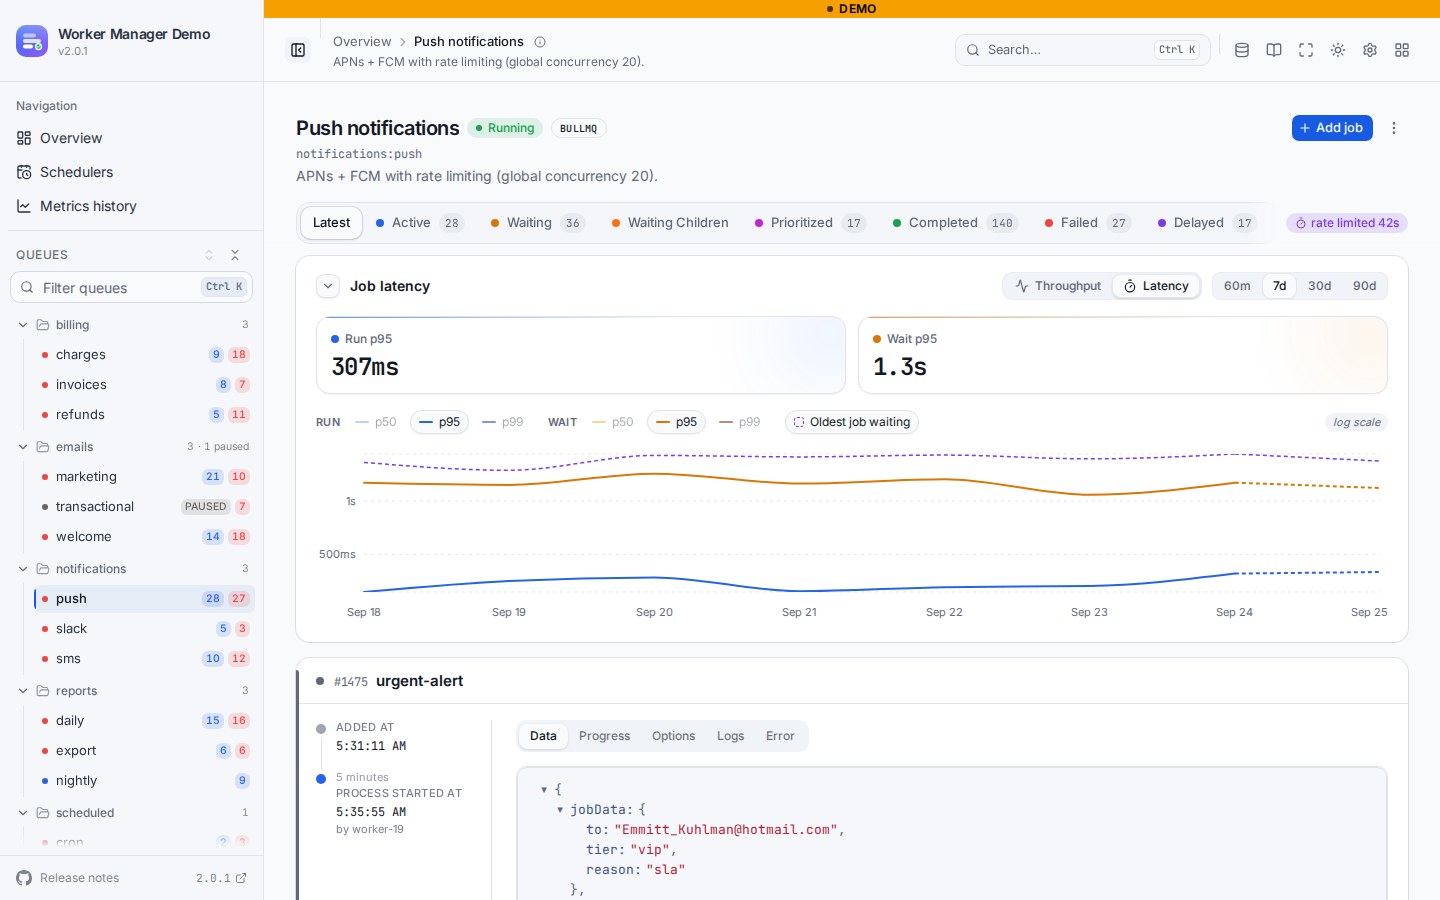
Run p95, wait p95 and queue age are drawn by default; p50 and p99 for each are a click away in the legend, and what you enable is remembered. The axis is logarithmic, and labelled as such. Latency spans orders of magnitude, so on a linear axis a p99 measured in minutes flattens p50 and p95 into a single line along the bottom and the chart stops saying anything about the typical case.
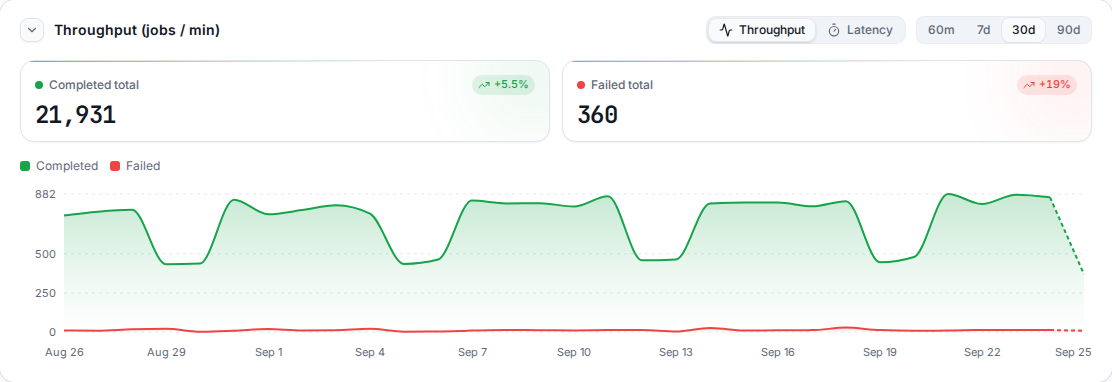
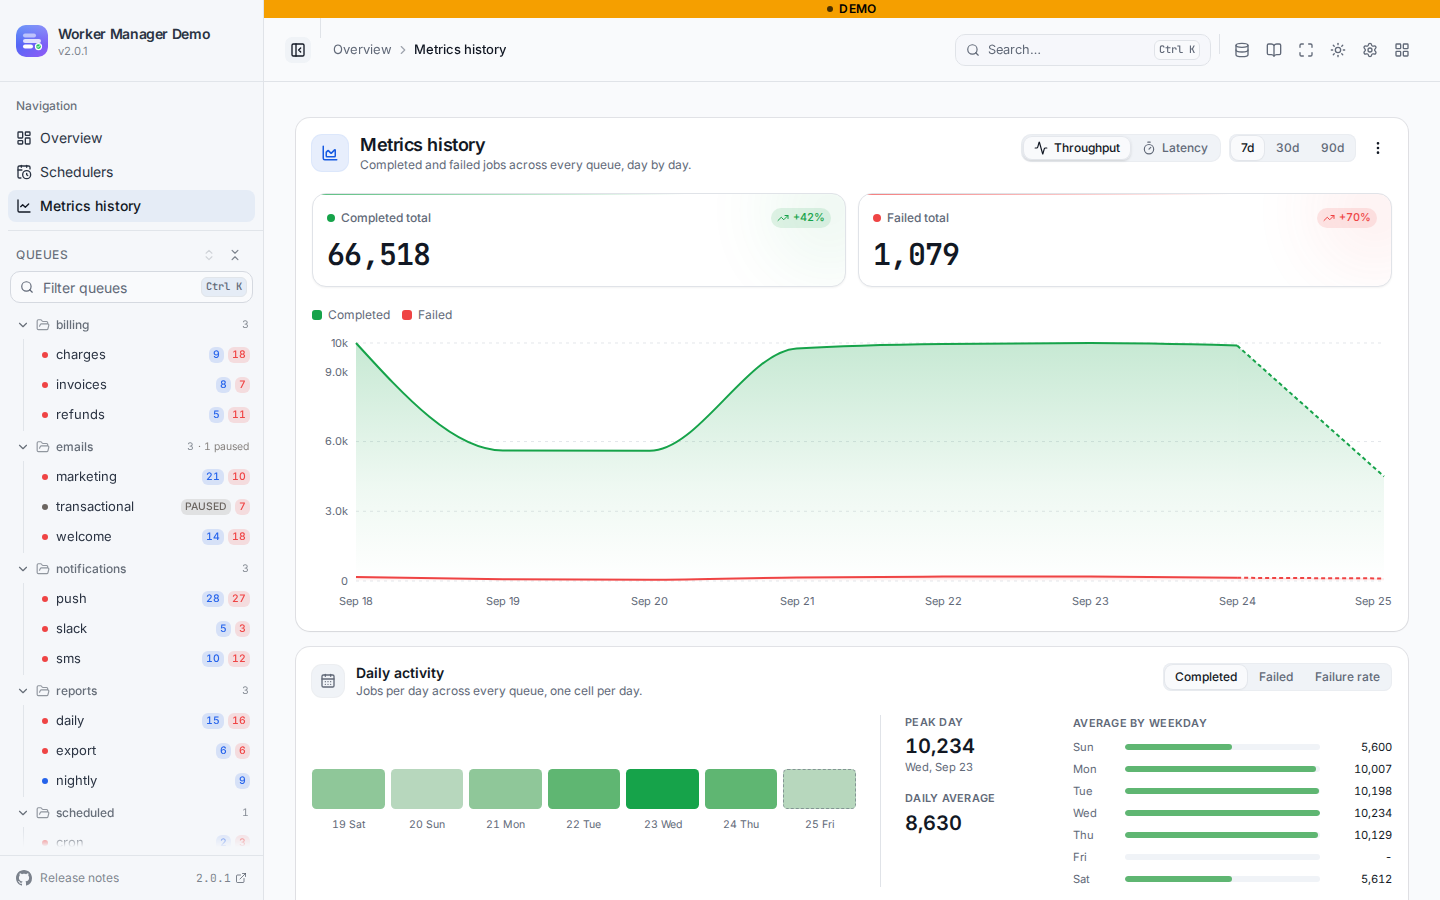
The newest point on any chart is drawn dashed while its bucket is still filling, because today's day, or the current hour, only covers the time elapsed so far and would otherwise read as a sudden drop.
Latency sampling is on by default whenever the recorder runs. Set latency: false to turn it off:
A latency tick that fails is swallowed rather than propagated, so a broken scan can't take the counter snapshot down with it, which also means a collector that has been failing since startup looks exactly like a board with no traffic. Pass onLatencyError: (error, queueName) => log(error) to tell the two apart; it stays silent if you don't.
Install
ioredis is a peer dependency; you already have it if you're using BullMQ. For PostgreSQL storage, add pg as well.
Set up the recorder
In the process where your workers run:
queues also takes a function, resolved on every tick rather than once. Reach for it when the queue set changes at runtime, whether you're discovering queues the way the CLI does or adding them through addQueue:
Retention is enforced by Redis itself, so old buckets expire on their own and there's nothing to prune by hand. Buckets are UTC-aligned, and every key the recorder writes is namespaced under worker-manager:metrics:, so it can't collide with BullMQ's own keys. Pass prefix to move that namespace, which is what separates two boards sharing one Redis:
Give the provider and any MetricsHistoryAdmin the same prefix. A provider pointed at a namespace nothing writes to reports empty history rather than an error, so a mismatch looks like a board that never recorded anything.
The default namespace was bull-board:metrics ({bull-board:metrics} on a cluster) before v2.0, and nothing is migrated. Pass prefix: 'bull-board:metrics' to the recorder, the provider and any MetricsHistoryAdmin to keep the history a 1.x board recorded.
On shutdown, call recorder.stop(). It clears the snapshot interval and, if the recorder created its own Redis connection internally, closes it too. If you passed in your own Redis instance, stop() leaves that connection alone, so it's a safe no-op to call either way.
Storage footprint
Worth understanding before you turn this on, since it writes to the same Redis your queues run on.
Three resolutions, three retentions
Every snapshot is written at three resolutions at once: per-minute buckets, an hourly rollup, and a daily total. They cost wildly different amounts, so each has its own retention:
Those figures are measured, not estimated: packages/metrics/tests/footprint.spec.ts writes real data through the real code path and asserts them. Absolute numbers shift a little with your Redis version and hash-max-listpack-entries, so the test pins the ratios rather than exact bytes and prints what it measured.
The minute tier is roughly 240 times more expensive than the hourly rollup covering the same day. That single ratio is what the whole design turns on.
What that adds up to
At the defaults, tracking both completed and failed:
Plus the cross-queue rollup, which costs about as much as one queue running at the combined rate, once, no matter how many queues you register.
Idle time is free. A minute with a zero count is never written, so the footprint follows how busy a queue actually is, not how long it has been recording.
Why the rollups exist
Keeping 90 days of minute-level detail costs about 15 MB per queue. Keeping 90 days of hourly detail costs about 55 KB, and the daily charts the UI actually draws don't read either one, they read the daily totals.
So rather than storing one expensive resolution and throwing detail away later, the recorder writes all three as it goes. Every tier is derived from the same delta in the same atomic script, so they can't drift apart, and there is no compaction job to schedule, resume, or make idempotent after a crash.
That's what lets the minute window default to 7 days instead of 90, which is where the ~93% saving comes from. Nothing you can see in the UI changes.
Tuning it
Every tier is optional and falls back to the default. Pass the same retention to RedisMetricsHistoryProvider so reads use the same window.
The minute window is the one to think about, for two reasons. It is where essentially all the storage goes, and it doubles as the recorder's catch-up window: after downtime, the recorder will not backfill minutes older than it. Set it to at least as long as you'd want to recover from an outage, and no longer than your workers' maxDataPoints buffer can supply anyway. The default of 7 days lines up with the recommended MetricsTime.ONE_WEEK.
Cutting minutes to 1 takes a busy queue from ~1.1 MB to ~200 KB, at the cost of only being able to catch up on a day of downtime. Hourly and daily history are unaffected either way.
retentionDays: N still works as a shorthand. It sets the hourly and daily windows to N and leaves the minute window at its default, so an existing config can't accidentally ask for a year of minute-level detail.
Nothing grows without a ceiling
Day-scoped keys carry a TTL that is only refreshed while that day is being written, so each one dies its tier's retention after the day it covers. The daily totals hashes are written every day, so their TTL keeps rolling forward; they're trimmed instead, dropping entries that fall outside the window on the first write of each new day. Both paths are covered by tests.
Upgrading from an earlier version is safe: days recorded before the hourly tier existed are still served, by folding their minute buckets on read.
What latency costs
The figures above are for the completed/failed counters. Latency histograms and the queue-age gauge use a different, packed storage format, so they're measured separately against a real Redis rather than derived from the same arithmetic: a queue where most jobs land in a couple of buckets each hour costs a lot less than one where all 18 buckets fill up every hour, and only a real measurement across both shapes tells you which end of that range to expect.
The line that decides whether this is affordable on a large board is the global rollup: it's a single shared cost for the whole board, not multiplied per queue, because there is exactly one __global__ key no matter how many queues are registered. 200 queues at typical traffic is roughly 200 × 254.5 KB, about 50 MB, plus the one shared 224 KB rollup, not 200 copies of it.
The round-trip count staying flat, and tick time barely moving between 5000 and 10000 jobs, come from the same design decision: above maxSamplesPerTick, the sampler takes a uniform subset of the finished jobs and scales the counts back up, rather than fetching every job, so a tick against a queue processing thousands of jobs a minute costs about the same as one processing hundreds.
Inspecting and clearing history from the board
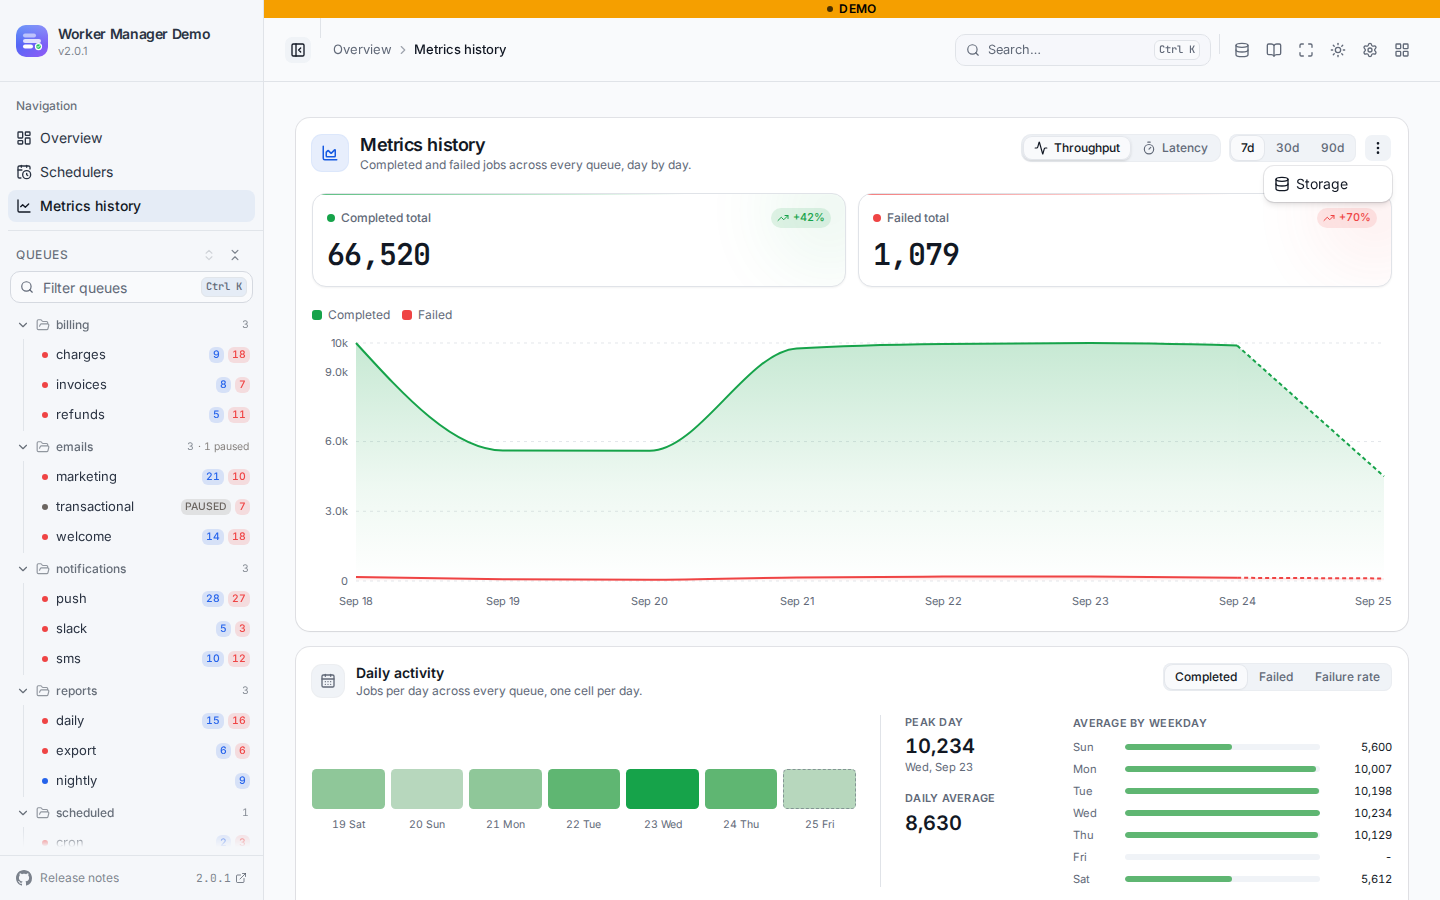
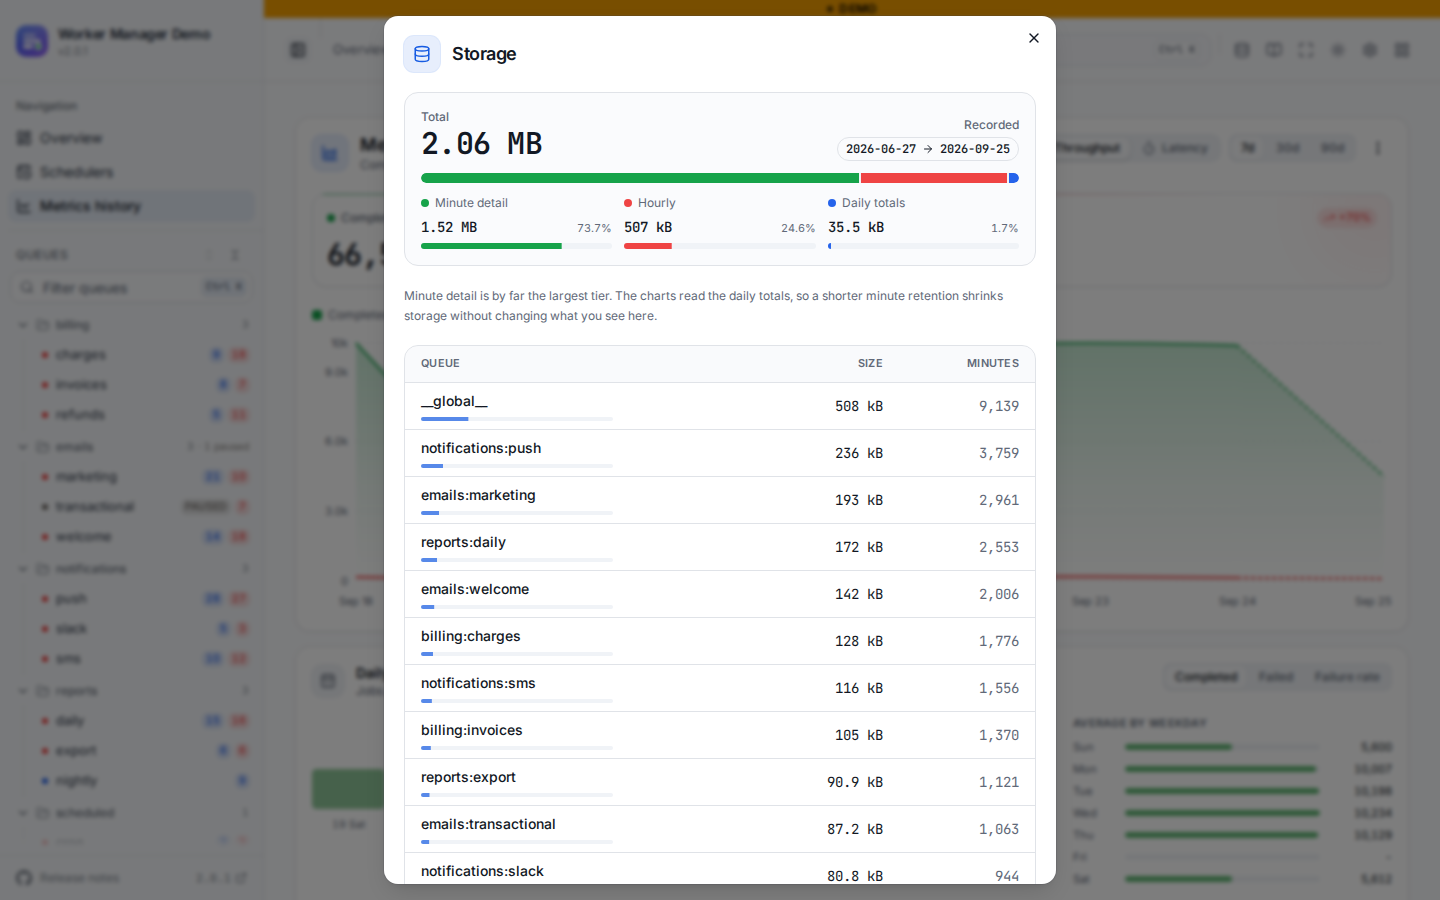
When the configured provider supports it (the shipped RedisMetricsHistoryProvider does), a Storage entry appears in the actions menu on the Metrics history page, next to the range selector. It's tucked into the menu because it's an occasional maintenance task rather than something you'd read day to day. Usage is only fetched when you open it, since measuring real memory use means reading every history key.
It shows the total footprint broken down by tier, so an unexpectedly large minute tier is visible at a glance, along with a per-queue table and the range of days on record.
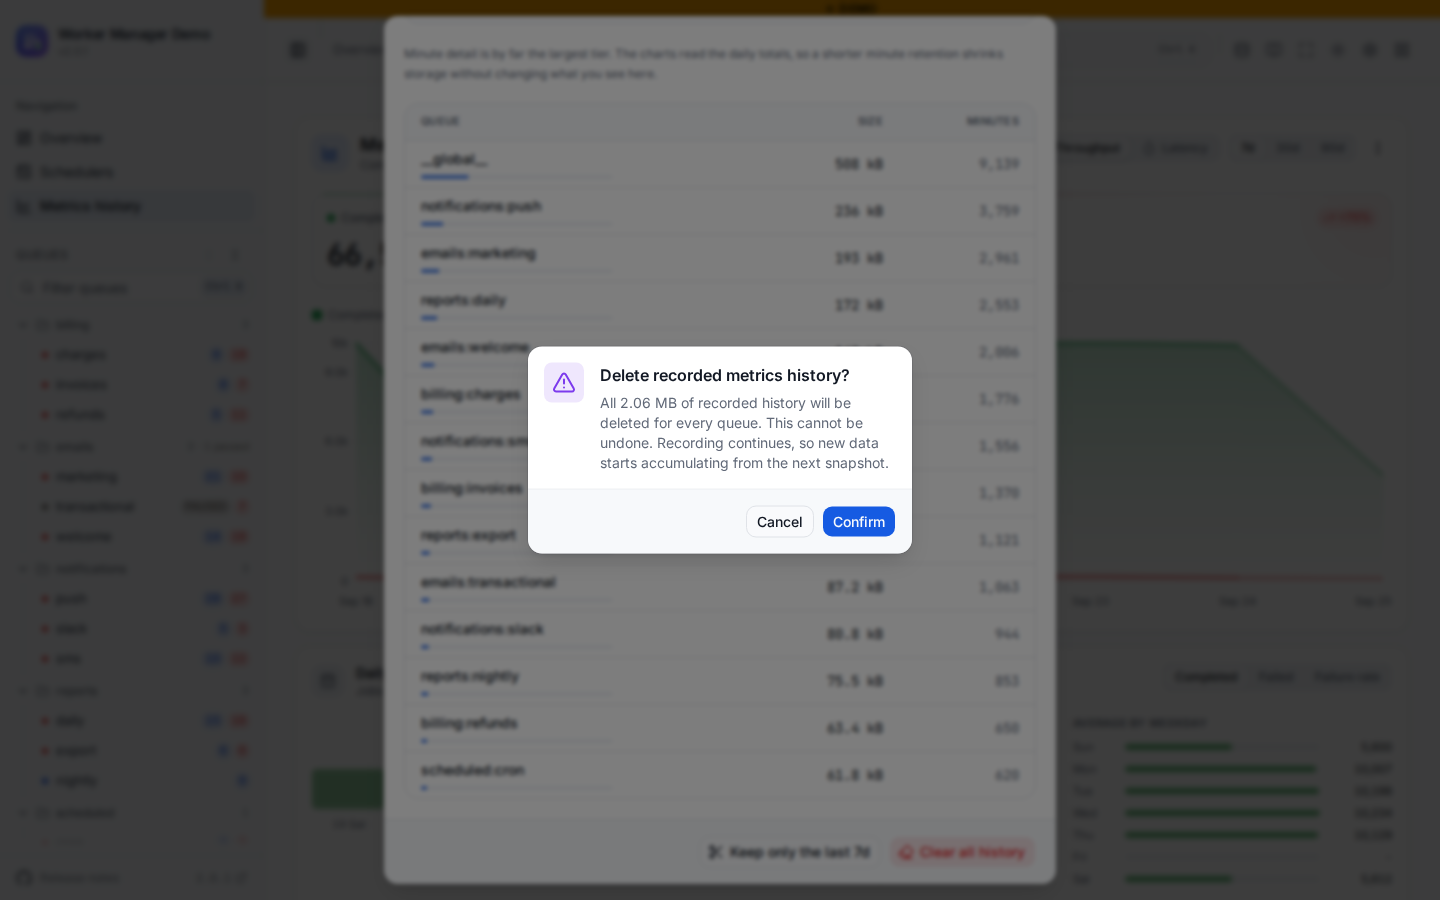
Two actions sit underneath it:
- Keep only the last 7d / 30d / 90d deletes everything recorded before the range you're currently charting.
- Clear all history deletes everything, for every queue.
Both open a confirmation that spells out exactly what goes: the cutoff date or the total size, that it can't be undone, and that the deleted days will stop appearing in the charts. Recording carries on either way, so new data starts accumulating from the next snapshot.
The actions are hidden when every registered queue is in readOnlyMode, matching how the rest of the board treats destructive operations. If your provider implements getUsage but not purge, the modal renders read-only.
One caveat on per-queue purges: the cross-queue rollup is corrected by subtracting the queue's own recorded values, so it needs those keys to still exist. A queue whose keys were already removed out of band, or whose minute hashes have aged out, can leave a residue in the rollup that a per-queue purge can't reach. Clearing all history resets it.
Inspecting and clearing history from code
MetricsHistoryAdmin is the same maintenance surface as a plain library object, for a debug endpoint, a one-off script, or a cleanup job.
stats() reports the real Redis footprint (MEMORY USAGE per key), split by tier and by queue, largest first, with the cross-queue rollup listed as __global__. Measurements go out in pipelined batches, so a namespace of a few thousand keys costs a couple of dozen round trips rather than a few thousand. It still reads every history key though, so treat it as an ops call rather than something to poll.
purge() deletes stored history. It's scoped to the recorder's namespace and driven by SCAN, so it never blocks Redis and never touches your queues' own keys. Against a cluster both calls scan every master, because SCAN carries no key for the client to route by and would otherwise answer from one arbitrary node:
Purging a single queue also subtracts that queue's numbers from the cross-queue rollup, so the Metrics history page reflects the queues that are left instead of keeping a deleted queue's throughput folded into the total. Purging is idempotent and safe to repeat, and the recorder simply starts refilling from the next snapshot.
Call admin.disconnect() when you're done. Like the recorder and the provider, it only closes the Redis connection if it opened one itself.
Register the provider
Where you build the board. The per-queue chart on each queue page needs showMetrics: true in uiConfig as well (see UIConfig); the dedicated "Metrics history" page below doesn't need it, but you'll usually want both:
Call provider.disconnect() alongside recorder.stop() on shutdown. Same rule applies: it only closes the Redis connection if the provider opened it itself.
What changes in the UI
Once a historyProvider is configured, hasHistoryProvider flips on and things show up in two places, gated by two separate settings.
With showMetrics: true, each queue's metrics chart gains a range selector: 60m, 7d, 30d, 90d. 60m stays exactly what it was, the live native view straight off the ring buffer. The longer ranges switch to reading from the history provider instead. Without showMetrics: true, the per-queue chart doesn't render at all, range selector included, regardless of whether a historyProvider is set. The chart can also be collapsed with the chevron in its header; the collapsed state is remembered.
A "Metrics history" page also appears in the sidebar, independent of showMetrics. It's a cross-queue view, the closest thing Worker Manager has to a wallboard: total completed/failed throughput across every registered queue, over the same range selector, plus a per-queue breakdown table underneath, sorted by total runs.
Each row in that table carries a bar scaled against the busiest queue and split into a completed and a failed segment. Bar length compares volume between queues, the split compares outcomes inside one queue, and hovering a bar gives the exact counts. A queue that only fails a fraction of a percent of its runs would otherwise draw a segment too thin to see, so a non-zero segment never shrinks below 1% of the track. The failure rate is spelled out next to the failed count.
Leave historyProvider unset and none of this appears; the board behaves exactly as it did before.
pg-boss queues
pg-boss keeps no per-minute metrics buffer, so there is nothing for the recorder to snapshot. What it does keep is every finished job, with the time it finished, for as long as the queue's deleteAfterSeconds allows. @worker-manager/pg-boss turns that into the same history a BullMQ board gets: pgBossMetricsSources hands the recorder one source per queue, and each source counts the queue's jobs by the minute of completed_on.
sources is resolved on every tick, so a queue created after start is recorded from its first tick, and the engine's queues allowlist applies. It can also be built without a board, from the same options createPgBossBoard takes under pgBoss: pgBossMetricsSources({ connection, schema }). That opens a reader of its own, which sources.close() ends. Nothing is written to the pg-boss schema: the sources only read.
What gets recorded:
A minute is only handed over once it has closed on the database clock, with a five-second margin (safetyMarginMs) for a completing transaction that commits after its minute ended. After a restart the recorder resumes from the newest minute it already stored rather than re-reading the whole minute window, because pg-boss may have deleted some of the jobs it counted, and a recount would write a smaller number back over the recorded one.
The index it needs
The counts and the latency scan read a range of completed_on inside one queue. pg-boss has no index for that, so without one every tick reads every retained row of the queue. The sources therefore look for a usable index when a queue first appears (through pg_indexes, every five minutes after that), and without one they keep that queue's counters and latency scan off and say so once through onWarning (console.warn by default). The queue-age gauge stays on either way; pg-boss's own fetch index covers it.
The index, which this package never creates for you:
job is partitioned (a job_common default partition plus one table per queue created with partition: true), and on a partitioned table that statement takes a lock that blocks writes on every partition while it builds. On a busy schema, build it per partition instead, without blocking:
The parent index turns valid once every partition has one attached, and a queue partitioned later gets its own automatically. Any valid btree index whose leading columns are (name, completed_on) counts, on job or on the queue's own table, with no predicate or one that keeps both completed and failed. pg-boss's schema drift check lists an index like this under extraIndexes without failing, and its reindex tooling handles it like its own.
Two boards, one store
pg-boss queues record as pgboss:<schema>:<queue>, and their cross-queue totals go into pgboss:<schema>:__global__ rather than __global__. namespacedHistoryProvider(provider, 'pgboss:<schema>:') is the pg-boss board's view of that: queue names without the prefix, and its own global series. pgBossMetricsNamespace(schema) and sources.namespace both give the prefix. That is what lets a BullMQ board and a pg-boss board in one app share one PostgresMetricsStore (or one Redis namespace) with neither global chart counting the other's jobs. One recorder can record both at once: new MetricsRecorder({ store, queues, sources }).
The pg-boss board's storage panel lists only its own queues, and its "clear all" stays inside the namespace. The BullMQ board sharing the store is not namespaced, so its storage panel lists the pg-boss queues too, and its "clear all" clears them as well. Clearing a single queue is scoped correctly on both.
Retention
The series can only reach back as far as pg-boss keeps finished jobs: deleteAfterSeconds, seven days by default, which is the same order as the recorder's minute window. A recorder that is down for longer than that loses the minutes in between for good, exactly like a BullMQ recorder that outlives its workers' maxDataPoints. Once recorded, the history follows the recorder's retention (90 days by default), however soon pg-boss deletes the jobs.
Queue depth
With persistQueueStats: true on a queue, and some instance running supervise, pg-boss keeps its own queue-size snapshots in queue_stats. readPgBossQueueDepth(engine, queue, { from, to, bucketSeconds, aggregate }) folds them into buckets, the same way pg-boss's getQueueStatsHistoryBucketed does. The board serves the same series at GET /api/pg-boss/queues/:queueName/depth?range=1h|6h|24h|7d and draws it as the queue depth chart on each queue page; see the pg-boss page.
Redis Cluster
Hand connection a Cluster and the recorder, the provider and the admin all work. One detail of the key layout is worth knowing before you turn it on.
Each snapshot writes a queue's three tiers and the three __global__ rollup tiers in one EVAL. That single script is what makes the write idempotent at every resolution at once: it computes the delta against the minute already stored and applies it everywhere, so a restart or a second recorder re-snapshotting the same window adds nothing. Redis Cluster rejects a multi-key command whose keys fall in different slots, so those six keys have to share one.
The namespace therefore carries a hash tag whenever the connection is a cluster: worker-manager:metrics is written as {worker-manager:metrics}, and a prefix of your own is wrapped the same way unless it already contains a {...} tag, in which case yours is used as given and picks the slot.
One slot means a single master holds the history for the whole board. That is the cost of keeping the cross-queue rollup correct on write instead of recomputing it on every read, and it is small: the numbers in Storage footprint are the whole of it, roughly 50 MB at 200 busy queues, plus one EVAL per queue per metric per minute.
Standalone keys are untagged and unchanged, so an existing deployment keeps the history it has. Nothing carries across from a standalone Redis to a cluster, since the key names differ.
Latency sampling reads BullMQ's own keys over the same connection, so your queues need the hash-tagged prefix BullMQ already requires in cluster mode (new Queue(name, { prefix: '{bull}' })). Without one a queue's keys scatter across slots and the sampler's pipelines are rejected; it swallows that error to protect the counter snapshot, so pass onLatencyError if you want to see it.
The board's own Redis stats panel is cluster-aware too: memory and client counts are summed across the masters and the uptime is the youngest node's, rather than reporting whichever node INFO happened to reach.
The CLI and the Docker image reach a cluster with --cluster, and --history works there the same way.
Stability
@worker-manager/metrics is stable since 2.5.0. Its main entry follows semver, and so do both storage layouts: a minor or patch upgrade reads and writes the history an earlier 2.x release recorded, in Redis and in PostgreSQL alike. The @worker-manager/metrics/internal entry is the exception. It holds the building blocks Worker Manager's own packages use, such as LatencyStore and the CounterSource interface, and may change in any release.
Both layouts are versioned, and a build never writes storage that a newer build laid out:
- The PostgreSQL tables record
schema_versionin theirmetatable, checked or migrated before the first query (see Tables and migrations). - A Redis namespace records its layout in the hash
<namespace>:__meta__, fieldlayout, currently1(REDIS_METRICS_LAYOUT_VERSION). On a cluster the key sits inside the namespace's hash tag, next to the data. The recorder writes the marker on its first snapshot. History recorded before 2.5.0 has no marker and is already layout 1, so it is adopted as it is.
When the marker or the schema version is newer than the installed package, the recorder refuses every snapshot before writing anything, and the error names both versions. Pass onSnapshotError to see it; await recorder.snapshot() throws it. A purge from MetricsHistoryAdmin or the storage panel is refused the same way, while the charts keep reading.
Scope
This is BullMQ and pg-boss. Bull v3 has no native metrics to snapshot. Completed and failed throughput, wait time, run time, and queue age are tracked; there's no history for other job states or for job data itself.
The shipped UI reads daily rollups. The provider also supports hourly granularity through the /api/metrics/history endpoint (granularity: 'hour') for custom consumers, though the built-in charts and the Metrics history page don't use it.